“£84,000 a year saved by preventing repeat pump failures.”
That's a figure I'd want to understand before putting it in a management presentation. Which payments would stop? How much production would the plant recover? What would it cost to make the change?
Let me use a made-up example. All the people, records and figures here are invented. It's a proposed way to examine a benefit claim, with no achieved savings behind it.
Leah, a reliability engineer, is preparing a proposal to address repeat failures on a pump package. The team has identified a defect to investigate and a possible change to its repair arrangements. The technical change still needs the site's review.
The headline numbers look encouraging. During 2026 there were 6 repeat interventions, £18,000 in parts and contractor bills, 72 hours of employee time at an allocation rate of £50 an hour, and 48 hours when the package was unavailable. Someone has attached an hourly sales value of £1,300 to the downtime.
You could feed those totals to an AI assistant and ask for a summary. An illustrative draft might say:
Preventing these failures will save £84,000 a year, combining £18,000 in repair costs, £3,600 in labour and £62,400 in recovered production.
I've written that line to illustrate the problem. It isn't output from a model trial. The arithmetic follows the supplied totals: 72 × £50 = £3,600, and 48 × £1,300 = £62,400. Add £18,000 and you get £84,000.
Leah opens the records. There's rather more to check than the addition.
Start with the payments
The £18,000 consists of £2,000 in issued parts and £1,000 in externally billed repair support for each of the 6 interventions. Finance checks that these are separate charges, with no employee labour included in the contractor figure.
For this example, the proposed change is assumed to prevent 3 of those interventions in the next year. That assumption needs testing. The records show what happened; they don't show what the change will prevent.
If it works as assumed, the avoided expenditure would be 3 × (£2,000 + £1,000) = £9,000. Finance also checks that the parts purchases would actually fall and that the contractor charges vary with the work. A fixed annual contract would need a different treatment.
The £3,600 labour figure needs its own conversation. The employees are salaried and the team plans to retain them. Preventing 3 interventions would release 36 hours, valued at £1,800 using the supplied £50 allocation rate. The salary bill would stay the same.
I'd keep those 36 hours visible. The planner might use them for overdue corrective work, training or investigation. The team would need to say where the time went before claiming that extra work had been delivered. Adding £1,800 to a cash saving would suggest a payment had disappeared when it hadn't.
There are costs to introduce the change, too: an assumed £6,000 for additional annual support and £4,000 for setup in the first year. These are extra payments, with no overlap with the avoided repair bills.
So the first year's repair and programme payments would increase by £1,000: £10,000 added, £9,000 avoided. That's quite a different sentence from the opening claim.
Follow the downtime into the plant
Leah asks operations to put the package-unavailable intervals beside the production-loss log.
Of the 48 hours, 12 were covered by a standby package carrying the full duty. Another 12 fell within a planned plant shutdown. These are separate intervals. Neither group caused additional production loss in this example.
That leaves 24 hours of line production loss attributable to the repeat failures. The team has checked overlapping events so the same lost hour appears once.
A shorter repair could still be useful during a shutdown. It could reduce workload or protect the restart date. You'd need evidence of that effect before attaching extra production to it.
The central proposal assumes the change would prevent half of those 24 line-loss hours, giving 12 recovered hours. This is a second assumption. Preventing half the interventions doesn't automatically recover half the lost production; the particular failures and operating conditions matter.
Operations therefore needs to test whether those hours would occur when the line could run, whether another constraint would limit output, and whether the product could be sold. If production can be caught up later using spare capacity, the value needs reassessing. Faster repairs on the package don't establish extra annual sales on their own.
In this fictional case, operations accepts an assumption of 10 additional saleable units per recovered line hour, with sufficient demand and no later catch-up of the lost output. These conditions are part of the calculation. Take them away and the benefit changes.
Give the recovered output a value
The £1,300 rate came from 10 units an hour at a selling price of £130 each. It describes sales revenue.
Producing those units would also incur £30 per unit in extra materials, energy and other variable costs. Finance accepts that invented rate for this example. Each additional unit would therefore contribute £100 after those costs.
For 12 recovered hours, the calculation is:
12 hours × 10 units/hour × (£130 − £30) per unit = £12,000.
That comprises £15,600 in additional sales less £3,600 in additional variable costs. The £12,000 is a modelled contribution from output the team expects to recover. It hasn't arrived in an account.
This wider view of maintenance cost runs through my draft reliability handbook: the repair bill and the consequences of unavailable equipment both need attention. I'd still want to follow each consequence through the actual plant before giving it a value.
My 2017 MSc dissertation used a business-case model for a particular oil and gas company, drawing on its historical loss and maintenance-cost data and assumptions about possible improvements. It included the cost of a proposed reliability programme. Those were estimated scenarios, rather than measured results from implementing the recommendations.
I'm using that habit of exposing assumptions here. The new pump example has its own figures and limits; it doesn't transfer the dissertation's estimated returns to another site.
Put the pieces beside each other
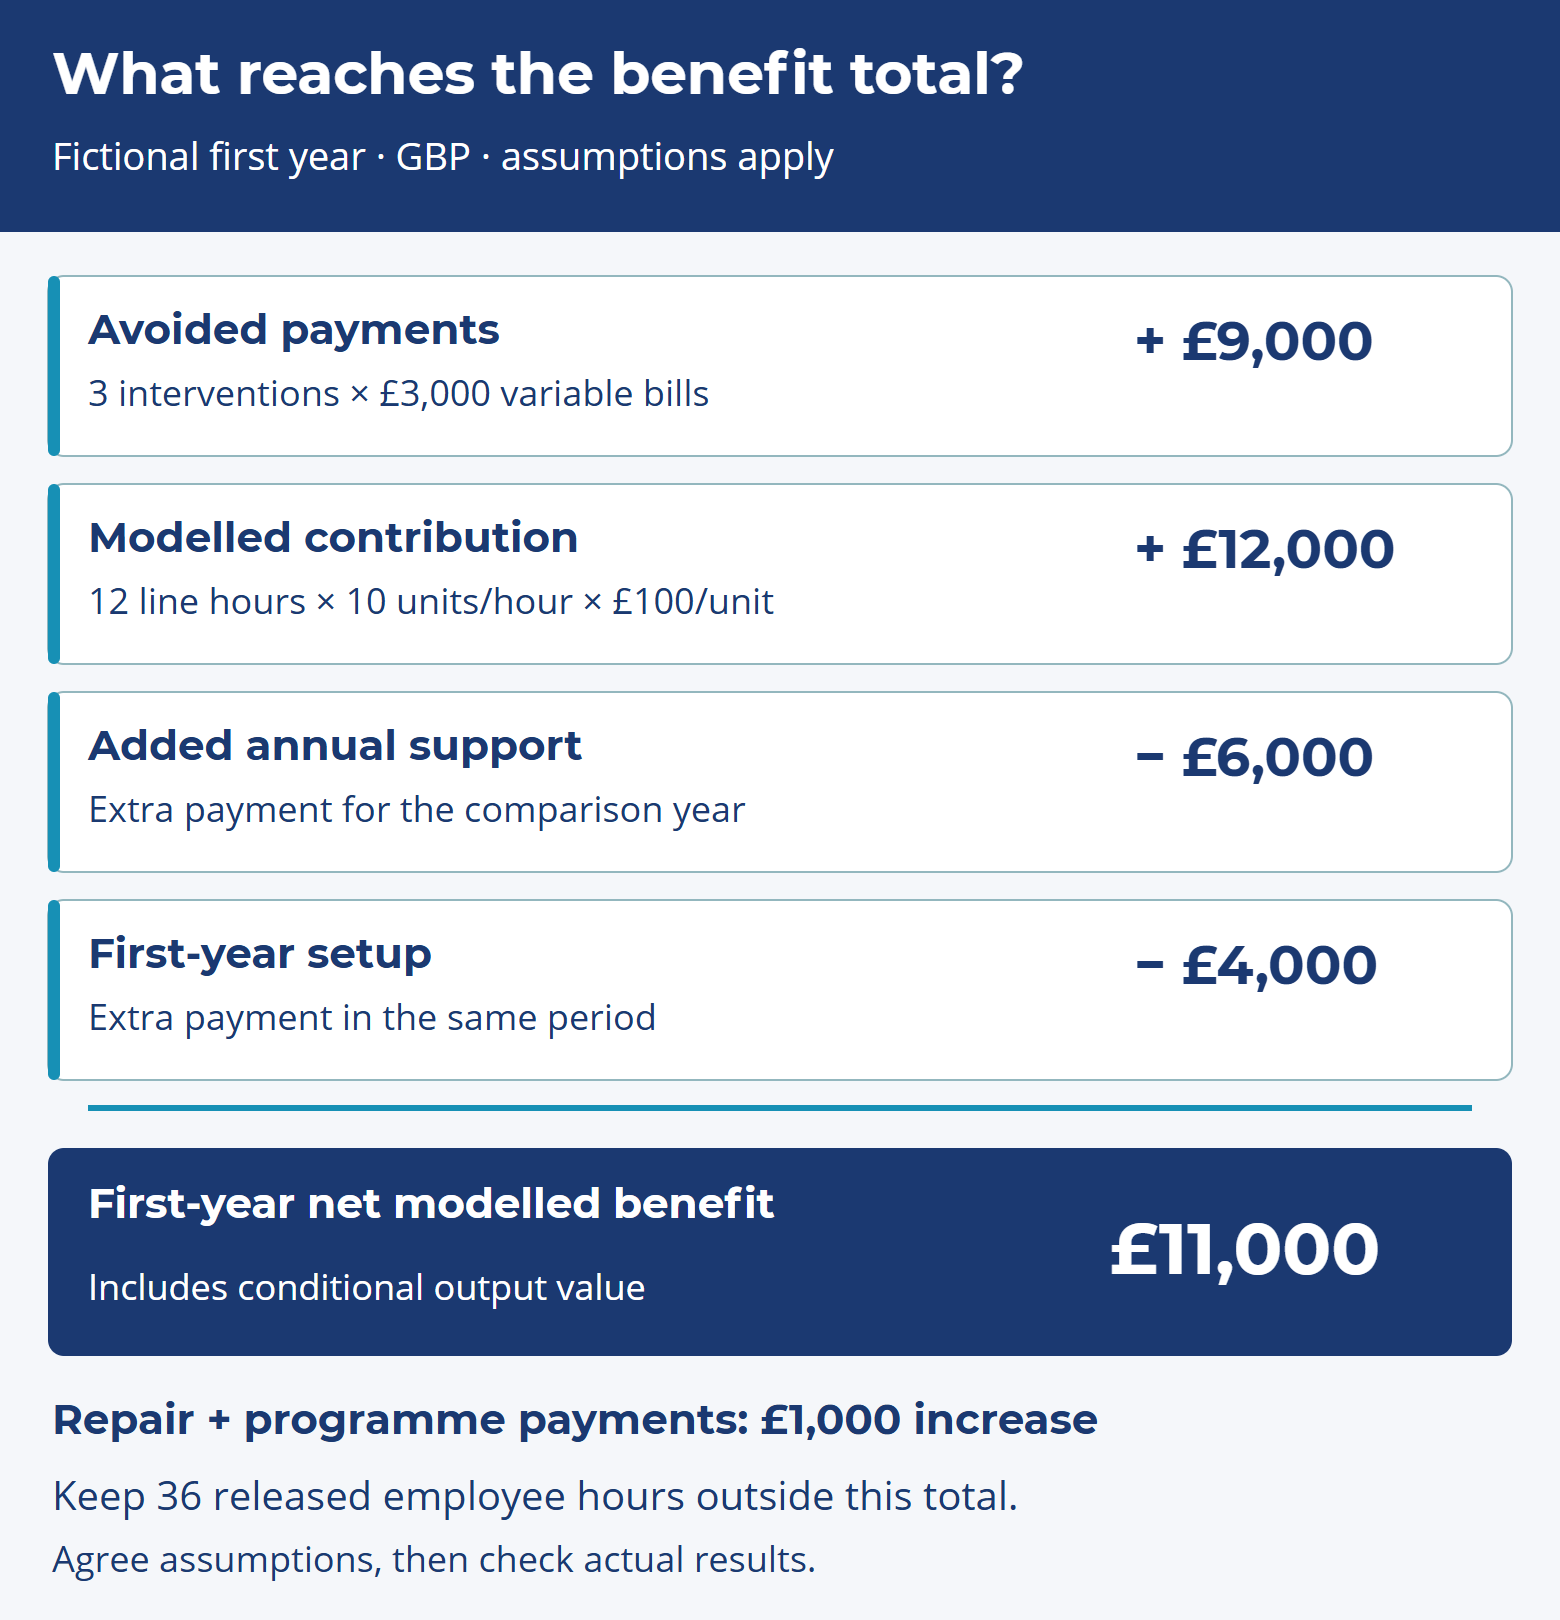
The comparison covers 1 January to 31 December 2027 against continuing the existing arrangement for that same period. The unchanged baseline uses the invented 2026 records, assuming the same duty, prices and workload. The calculation assumes the change operates from the start of 2027, with all £4,000 of setup spending included in that year.
All values are pounds sterling at constant illustrative prices, excluding VAT. There's no currency conversion. This is a simple undiscounted comparison before tax and financing. It isn't a full investment appraisal.
 Open full-size image (opens in a new tab)
Fictional first-year comparison. The £11,000 depends on the accepted assumptions; the released employee time stays outside the monetary total.
The resulting £11,000 is a first-year net modelled benefit: £9,000 + £12,000 − £6,000 − £4,000. I'd put that description beside the number whenever it leaves the worksheet.
You can check it another way. The £1,000 increase in repair and programme payments plus £3,600 in extra production costs gives a £4,600 rise in total expenditure within this comparison. The £15,600 additional sales less £4,600 gives the same £11,000 benefit. The production cost comes out once.
There are several ways to count the same benefit twice. Adding the £15,600 sales figure to the £12,000 contribution would count the recovered output twice. Counting the same downtime under both the pump and the line would inflate the hours. Claiming an avoided contractor bill and the same hours as reduced employee cost would also need checking against who actually did the work.
Even the released time could overlap another proposal. If a planning improvement already claims those 36 hours, both projects can't quietly take full credit for them.
I've left safety, environmental consequences, longer equipment life and any extra work done with released time outside this monetary total. They haven't been valued here. The team still needs to consider the site's safety and environmental requirements when deciding whether the proposed change is acceptable.
Ask what would change the decision
Leah takes a less attractive version to the review as well.
Suppose the change prevents only 1 intervention and recovers 4 line hours. Holding the other assumptions fixed gives £3,000 in avoided bills plus £4,000 in contribution, less £10,000 in added programme payments: a £3,000 negative first-year benefit.
With 4 interventions avoided and 16 line hours recovered, the same calculation gives £18,000 positive benefit. Those are illustrative scenarios, not confidence limits or assigned probabilities. The team needs evidence to judge which combinations are plausible, including whether failure frequency and loss duration would move together.
I'd want the review to spend time on those uncertain inputs. What evidence supports preventing 3 interventions? Which lost hours could this change affect? What happens if introduction takes longer or the support costs more?
The benefits-assumptions worksheet holds the baseline, formulas, exclusions and unresolved checks. It's a static calculation aid with a worked example and blank prompts. A reliability engineer can prepare it with operations and finance; the people responsible for the records accept their inputs.
In this example, Nina, the site manager, owns the improvement decision. She and the accountable team must accept the assumptions and technical requirements before committing to the change. They also agree who will check the actual bills, interventions, production losses and use of released time afterwards. A forecast gives them something to test.
That follow-through connects to building a culture of reliability through everyday work. The planned companion, “Choosing the next improvement with limited time”, will address comparing competing demands. Here, I'd start by getting one proposal's benefit claim into a form the team can defend.
Keep the attractive headline if the evidence supports it. First, sit down with the people who know which payments, hours and production figures could actually change. Let the number follow that conversation.